
QuantDesk® Machine Learning Forecast
for the Week of May 29th, 2018
Using Deep Learning To Validate Alternative Data

by Erez Katz, CEO and Co-founder of Lucena Research.
Background
We’ve concluded a three-part series in which we discussed approaches to classifying stocks’ price action with timeseries data coupled with deep learning technology. Specifically, we discussed:
- Deploying historical trends into fully connected networks with a wide input layer where input neurons represent data values as point-in-time from present back to some time in history.
- Transforming one-dimensional trends into rich, multi-dimensional image representations and deploying convolutional neural networks (CNNs) to identify predictive spatial formations.
- Applying recurrent neural networks (RNNs), more specifically LSTM (long short-term memory units) in order to allow the network to learn and determine what historical data should be stored or discarded for effective stock price-action forecasting.
I’ve received a lot of great feedback on LinkedIn and, to that end, I’d like to address a few points:
- It’s important to distinguish between forecasting the actual price of a stock vs. its direction (higher or lower). Even when we attempt to forecast the stock’s directional price action, we do it in the context of price action relative to a benchmark. Take, for example, a stock-price move relative to the S&P; 500 (market relative price move). To truly forecast what the price of a stock may be a few days or a few months in the future, the solution would most likely have to be regression-based and deterministic. That’s a very tall order (and, in my opinion, impossible for high latency investments, the opposite of high frequency investments) given the dynamic and non-stationary nature of the stock market.
-
Our research is almost entirely focused on price action classification (whether a stock will be higher relative to its current
position), although in many cases we advance our deep learning classifiers
with other machine learning deterministic means (mainly Knn -- K nearest neighbors
-- decision trees and the like). All our research is based on achieving the
highest statistical significance by which we don’t expect to be right all the
time, but rather to be more right than wrong. This bodes well for deep neural
nets based on TensorFlow (an open source deep learning platform and framework,
developed by our friends at Google Brain) and Keras and Theano (open source
component libraries built on top of TenserFlow). The networks are trained to
minimize loss (the difference between the network outcome and the desired,
perfect knowledge, labeled outcome) in order to maximize accuracy and precision.
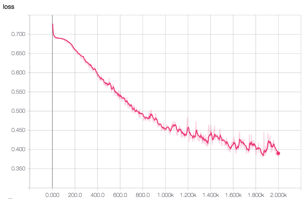

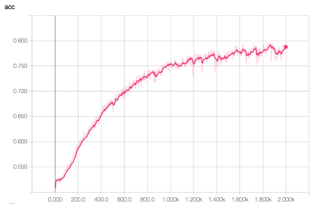
Image 1: TensorBoard graphical representation of training in action. We are training 10 futures constituents based on 15 or so features trended across 21 days in history that in turn were converted to richer two-dimensional images. Please note how over 2,000 epochs (data sampling in training) the CNN (in this particular example) is getting better and better over time. The loss function returns are moving lower (left image) while the accuracy and precision improve over time (middle and right images, respectively). - In addition, when we discuss timeseries data, we advocate daily features that are captured over time but not necessarily daily stock prices. Our research has yielded very little actionable insight from pure stock prices data or for that matter other simple technical features (which are based on price/volume information). The explosion of new alternative data brings exciting new dimensionality to deep learning research. Think, for example, about location data, corporate action data, social media sentiment scoring, consumer spending activity, 10-Ks and 10-Qs filings, newsfeed sentiment, speech to text analysis and much more. Each of these data elements is mapped to tradeable assets and captured daily to form its own timeseries representation. The networks are trained to assess how various features, captured as daily sentiment scores, trended over time. More importantly, the networks capture how trends of multiple orthogonal data sources when overlaid on top of each other (figuratively speaking) can present more compelling correlations to stocks’ price moves than assessing each feature alone.
How Effective Are Deep Nets In Asserting If A Data Source Is Predictive?
The process of deploying alternative data for price action classification is not only valuable for investors who are looking to deploy their own proprietary strategies. In fact, we are often hired by alternative data providers as an independent validator. Over time, as we’ve enhanced our classification technology, we became quite effective at streamlining the alternative data validation process. In addition, we pride ourselves on advising our clients about how to make their data more effective, and thus compelling, to the financial consumer.
The process of validating an alternative data source can be summed up in the following steps:
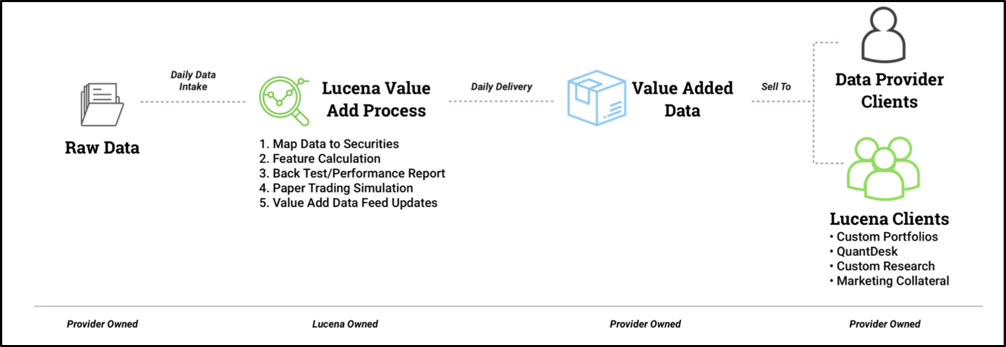
- Data Mapping – The process of aggregating (normally to daily time series) and mapping the aggregate score to tradeable securities.
-
Data Qualification Engine – The data qualification engine is a product we’ve developed to quickly assess the basic maturity
of a provider’s data. We test for data type consistency, universe coverage,
sentiment score distribution, survivorship bias, NANs, anomalies and outliers,
decile breakdown of signal strength to future returns, backtesting and more.

Image 4: The Data Qualification Engine – enables a quick assessment of mapped alterative data. The software enables loading a CSV file and quickly running an analysis which ultimately delivers a comprehensive DQE analysis report with a score of pass or fail. A failed score indicates that the data is not ready for further processing and requires additional attention by the data providers. - Feature Engineering – Lucena’s quants enhance the raw data with additional derived features more suitable to machine learning research. For example, we apply time decay, ranking scores against a universe of peers and more.
-
Event Signal Classification (Deep Learning or Traditional Decision Trees) --Event graph discovery searches for features and
their min/max thresholds that most consistently precede future returns. Our
engine determines which features work best together for highest future price
action consistency.
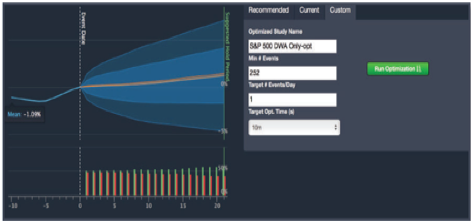
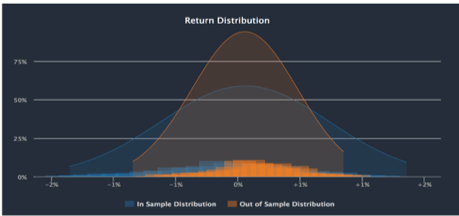
Image 5: Event Scan (left) demonstrates how signals on particular dates correspond to price action to follow. On the right, cross validation of signal to return distribution in/out of sample. -
Backtesting and Paper Trading Simulation – At the conclusion of the validation and enhancement processes, we are ready for
backtest simulation of a trading strategy that buys and sells stocks based
on the data provider’s signals. Any backtesting can be made a live paper traded
portfolio so that the signals to returns correlation is tested perpetually
into the future. In addition, Lucena provides a comprehensive performance and
attribution reporting analysis for a highly visual intuitive assessment.
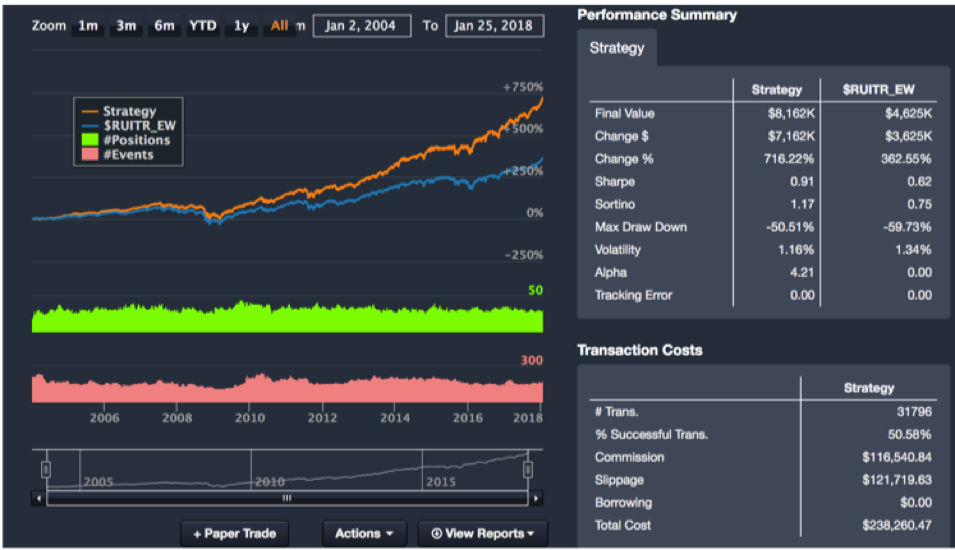
Image 6: Backtesting simulation of signals strength against a predetermined benchmark. Backtest closely simulates real-life scenario taking into account transactions cost, slippage, and not allowing peeking into the future. The paper trade button at the bottom of the image allows the backtest to continue into the future.
Conclusion
The very same technology used to deploy predictive signals for investment can be used to assess if an alternative data contains any information. Even the most sophisticated hedge funds are constantly looking for ways to determine if a data provider is worth pursuing. They want to be able to “fail fast” so that precious quant research isn’t wasted on unqualified data. Lucena is well-positioned to provide that quick yet thorough alternative data analysis so that the buy side is assured that an alternative data is predictive with meaningful information worth exploring.
Strategies Update
As in the past, we will provide weekly updates on how the model portfolios and the theme-based strategies we cover in this newsletter are performing.
Past performance is no guarantee of future returns.
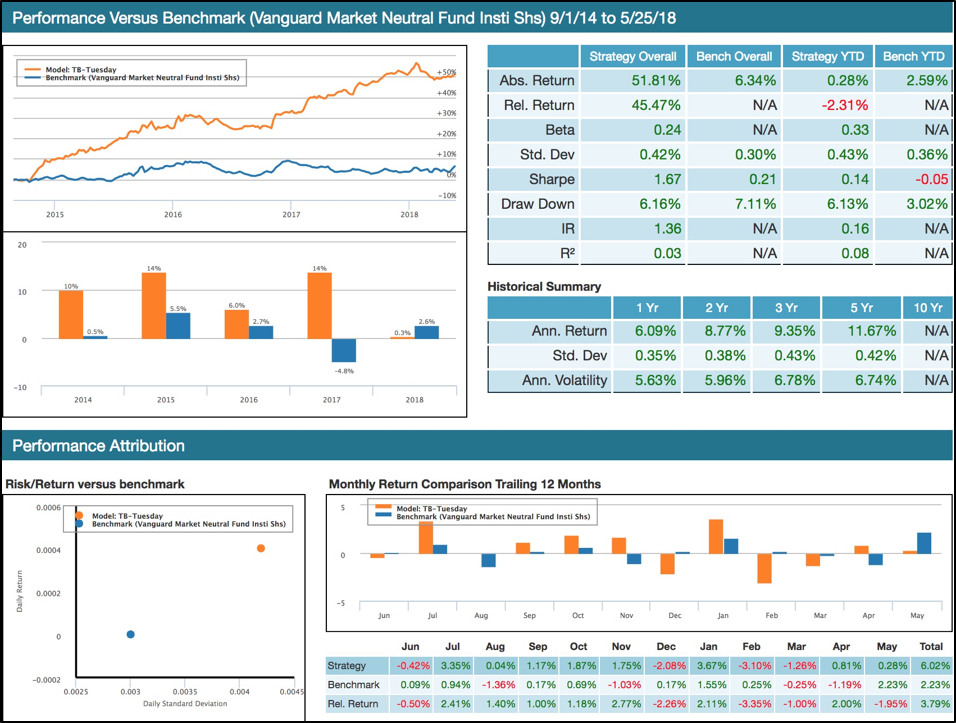
Tiebreaker has been forward traded since 2014 and to date it has enjoyed remarkably low volatility and boasts an impressive return of 51.81%, low volatility as expressed by its max-drawdown of only 6.16%, and a Sharpe of 1.67!
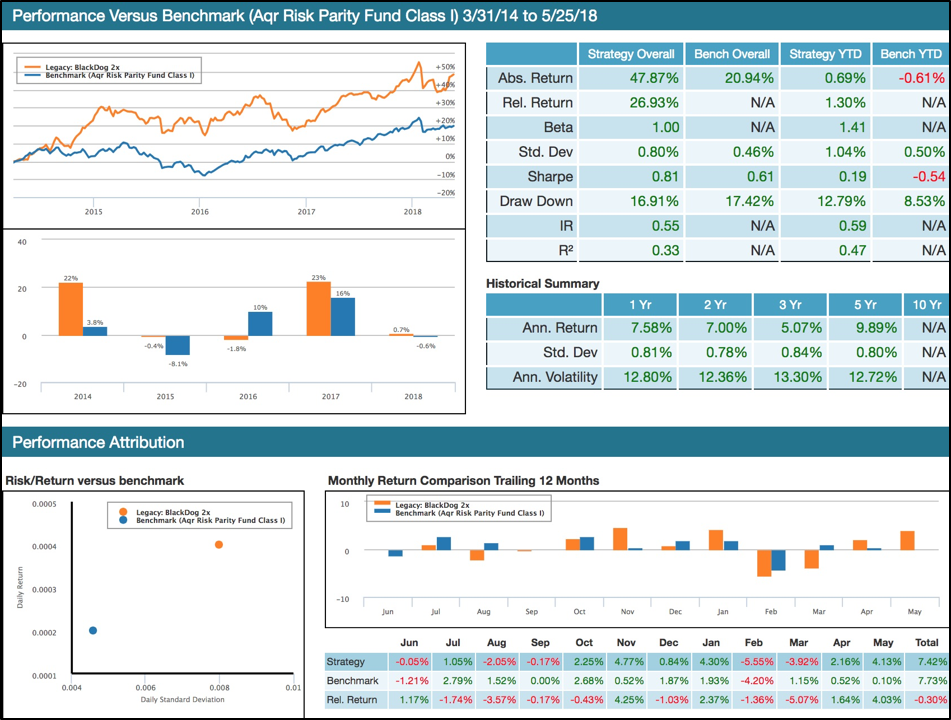
BlackDog – Lucena’s Risk Parity - Since Inception 47.87% vs. benchmark of 20.94%
We have recently developed a sophisticated multi-sleeve optimization engine set to provide the most suitable asset allocation for a given risk profile, while respecting multi-level allocation restriction rules.
Essentially, we strive to obtain an optimal decision while taking into consideration the trade-offs between two or more conflicting objectives. For example, if you consider a wide universe of constituents, we can find a subset selection and their respective allocations to satisfy the following:
- Maximizing Sharpe
- Widely diversified portfolio with certain allocation restrictions across certain asset classes, market sectors and growth/value classifications
- Restricting volatility
- Minimizing turnover
We can also determine the proper rebalance frequency and validate the recommended methodology with a comprehensive backtest.
Past performance is no guarantee of future returns.
Forecasting the Top 10 Positions in the S&P;
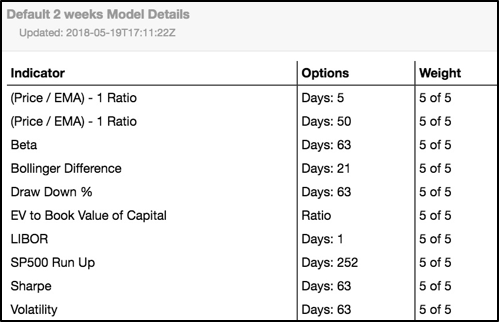
Lucena’s Forecaster uses a predetermined set of 10 factors that are selected from a large set of over 500. Self-adjusting to the most recent data, we apply a genetic algorithm (GA) process that runs over the weekend to identify the most predictive set of factors based on which our price forecasts are assessed. These factors (together called a “model”) are used to forecast the price and its corresponding confidence score of every stock in the S&P.; Our machine-learning algorithm travels back in time over a look-back period (or a training period) and searches for historical states in which the underlying equities were similar to their current state. By assessing how prices moved forward in the past, we anticipate their projected price change and forecast their volatility.
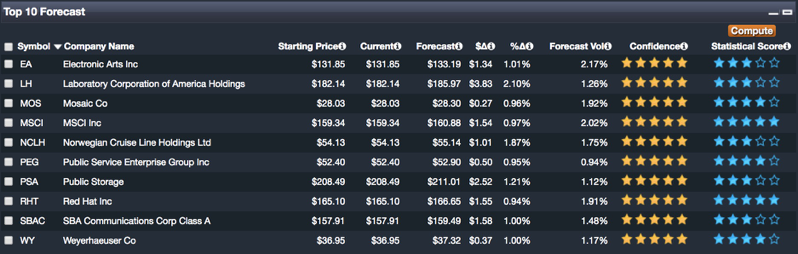
The charts below represent the new model and the top 10 positions assessed by Lucena’s Price Forecaster.
The top 10 forecast chart below delineates the ten positions in the S&P; with the highest projected market-relative return combined with their highest confidence score.
To view a brief video of all the major functions of QuantDesk, please click on the following link:

QuantDesk Overview
Analysis
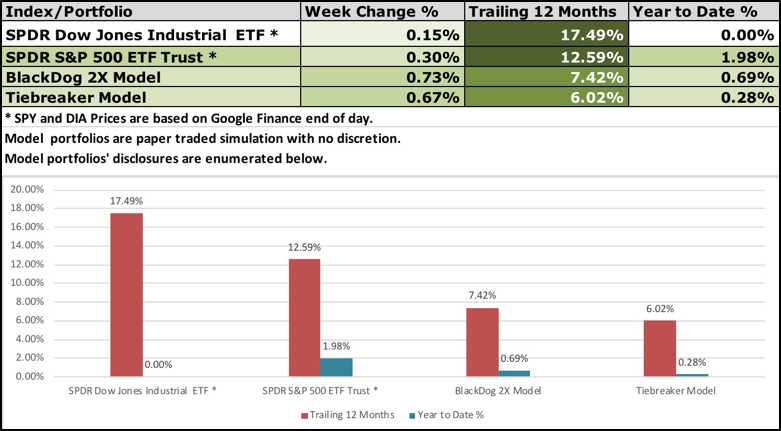
The table below presents the trailing 12-month performance and a YTD comparison between the two model strategies we cover in this newsletter (BlackDog and Tiebreaker), as well as the two ETFs representing the major US indexes (the DOW and the S&P;).
Past performance is no guarantee of future returns.
Appendix
For those of you unfamiliar with BlackDog and Tiebreaker, here is a brief overview: BlackDog and Tiebreaker are two out of an assortment of model strategies that we offer our clients. Our team of quants is constantly on the hunt for innovative investment ideas. Lucena’s model portfolios are a byproduct of some of our best research, packaged into consumable model-portfolios. The performance stats and charts presented here are a reflection of paper traded portfolios on our platform, QuantDesk®. Actual performance of our clients’ portfolios may vary as it is subject to slippage and the manager’s discretionary implementation. We will be happy to facilitate an introduction with one of our clients for those of you interested in reviewing live brokerage accounts that track our model portfolios.
Tiebreaker: Tiebreaker is an actively managed long/short equity strategy. It invests in equities from the S&P; 500 and Russell 1000 and is rebalanced bi-weekly using Lucena’s Forecaster, Optimizer and Hedger. Tiebreaker splits its cash evenly between its core and hedge holdings, and its hedge positions consist of long and short equities. Tiebreaker has been able to avoid major market drawdowns while still taking full advantage of subsequent run-ups. Tiebreaker is able to adjust its long/short exposure based on idiosyncratic volatility and risk. Lucena’s Hedge Finder is primarily responsible for driving this long/short exposure tilt.
Tiebreaker Model Portfolio Performance Calculation Methodology Tiebreaker's model portfolio’s performance is a paper trading simulation and it assumes opening account balance of $1,000,000 cash. Tiebreaker started to paper trade on April 28, 2014 as a cash neutral and Bata neutral strategy. However, it was substantially modified to its current dynamic mode on 9/1/2014. Trade execution and return figures assume positions are opened at the 11:00AM EST price quoted by the primary exchange on which the security is traded and unless a stop is triggered, the positions are closed at the 4:00PM EST price quoted by the primary exchange on which the security is traded. In the case of a stop loss, a trailing 5% stop loss is imposed and is measured from the intra-week high (in the case of longs) and low (in the case of shorts). If the stop loss was triggered, an exit from the position 5% below, in the case of longs, and 5% above, in the case of shorts. Tiebreaker assesses the price at which the position is exited with the following modification: prior to March 1st, 2016, at times but not at all times, if, in consultation with a client executing the strategy, it is found that the client received a less favorable price in closing out a position when a stop loss is triggered, the less favorable price is used in determining the exit price. On September 28, 2016 we have applied new allocation algorithms to Tiebreaker and modified its rebalancing sequence to be every two weeks (10 trading days). Since March 1st, 2016, all trades are conducted automatically with no modifications based on the guidelines outlined herein. No manual modifications have been made to the gain stop prices. In instances where a position gaps through the trigger price, the initial open gapped trading price is utilized. Transaction costs are calculated as the larger of 6.95 per trade or $0.0035 * number of shares trades.
BlackDog: BlackDog is a paper trading simulation of a tactical asset allocation strategy that utilizes highly liquid ETFs of large cap and fixed income instruments. The portfolio is adjusted approximately once per month based on Lucena’s Optimizer in conjunction with Lucena’s macroeconomic ensemble voting model. Due to BlackDog’s low volatility (half the market in backtesting) we leveraged it 2X. By exposing twice its original cash assets, we take full advantage of its potential returns while maintaining market-relative low volatility and risk. As evidenced by the chart below, BlackDog 2X is substantially ahead of its benchmark (S&P; 500).
In the past year, we covered QuantDesk's Forecaster, Back-tester, Optimizer, Hedger and our Event Study. In future briefings,
we will keep you up-to-date on how our live portfolios are executing.
We will also showcase new technologies and capabilities that we intend
to deploy and make available through our premium strategies and QuantDesk®
our flagship cloud-based software.
My hope is that those of you who will be following us closely will
gain a good understanding of Machine Learning techniques in statistical
forecasting and will gain expertise in our suite of offerings and
services.
Specifically:
- Forecaster - Pattern recognition price prediction
- Optimizer - Portfolio allocation based on risk profile
- Hedger - Hedge positions to reduce volatility and maximize risk adjusted return
- Event Analyzer - Identify predictable behavior following a meaningful event
- Back Tester - Assess an investment strategy through a historical test drive before risking capital
Your comments and questions are important to us and help to drive the content of this weekly briefing. I encourage you to
continue to send us your feedback, your portfolios for analysis,
or any questions you wish for us to showcase in future briefings.
Send your emails to:
[email protected] and we will do our best to address
each email received.
Please remember: This sample portfolio and the content delivered in this newsletter are for educational purposes only and NOT as the basis for one's investment strategy. Beyond discounting market impact and not counting transaction costs, there are additional factors that can impact success. Hence, additional professional due diligence and investors' insights should be considered prior to risking capital.
If you have any questions or comments on the above, feel free to contact me: [email protected]
Have a great week!
Disclaimer Pertaining to Content Delivered & Investment Advice
This information has been prepared by Lucena Research Inc. and is intended for informational purposes only. This information should not be construed as investment, legal and/or tax advice. Additionally, this content is not intended as an offer to sell or a solicitation of any investment product or service.
Please note: Lucena is a technology company and neither manages funds nor functions as an investment advisor. Do not take
the opinions expressed explicitly or implicitly in this
communication as investment advice. The opinions expressed
are of the author and are based on statistical forecasting
on historical data analysis.
Past performance does not guarantee future success. In
addition, the assumptions and the historical data based
on which opinions are made could be faulty. All results
and analyses expressed are hypothetical and are NOT guaranteed.
All Trading involves substantial risk. Leverage Trading
has large potential reward but also large potential risk.
Never trade with money you cannot afford to lose. If you
are neither a registered nor a certified investment professional
this information is not intended for you. Please consult
a registered or a certified investment advisor before risking
any capital.
The performance results for active portfolios following
the screen presented here will differ from the performance
contained in this report for a variety of reasons, including
differences related to incurring transaction costs and/or
investment advisory fees, as well as differences in the
time and price that securities were acquired and disposed
of, and differences in the weighting of such securities.
The performance results for individuals following the strategy
could also differ based on differences in treatment of
dividends received, including the amount received and whether
and when such dividends were reinvested. Historical performance
can be revisited to correct errors or anomalies and ensure
it most accurately reflects the performance of the strategy.